Welcome!
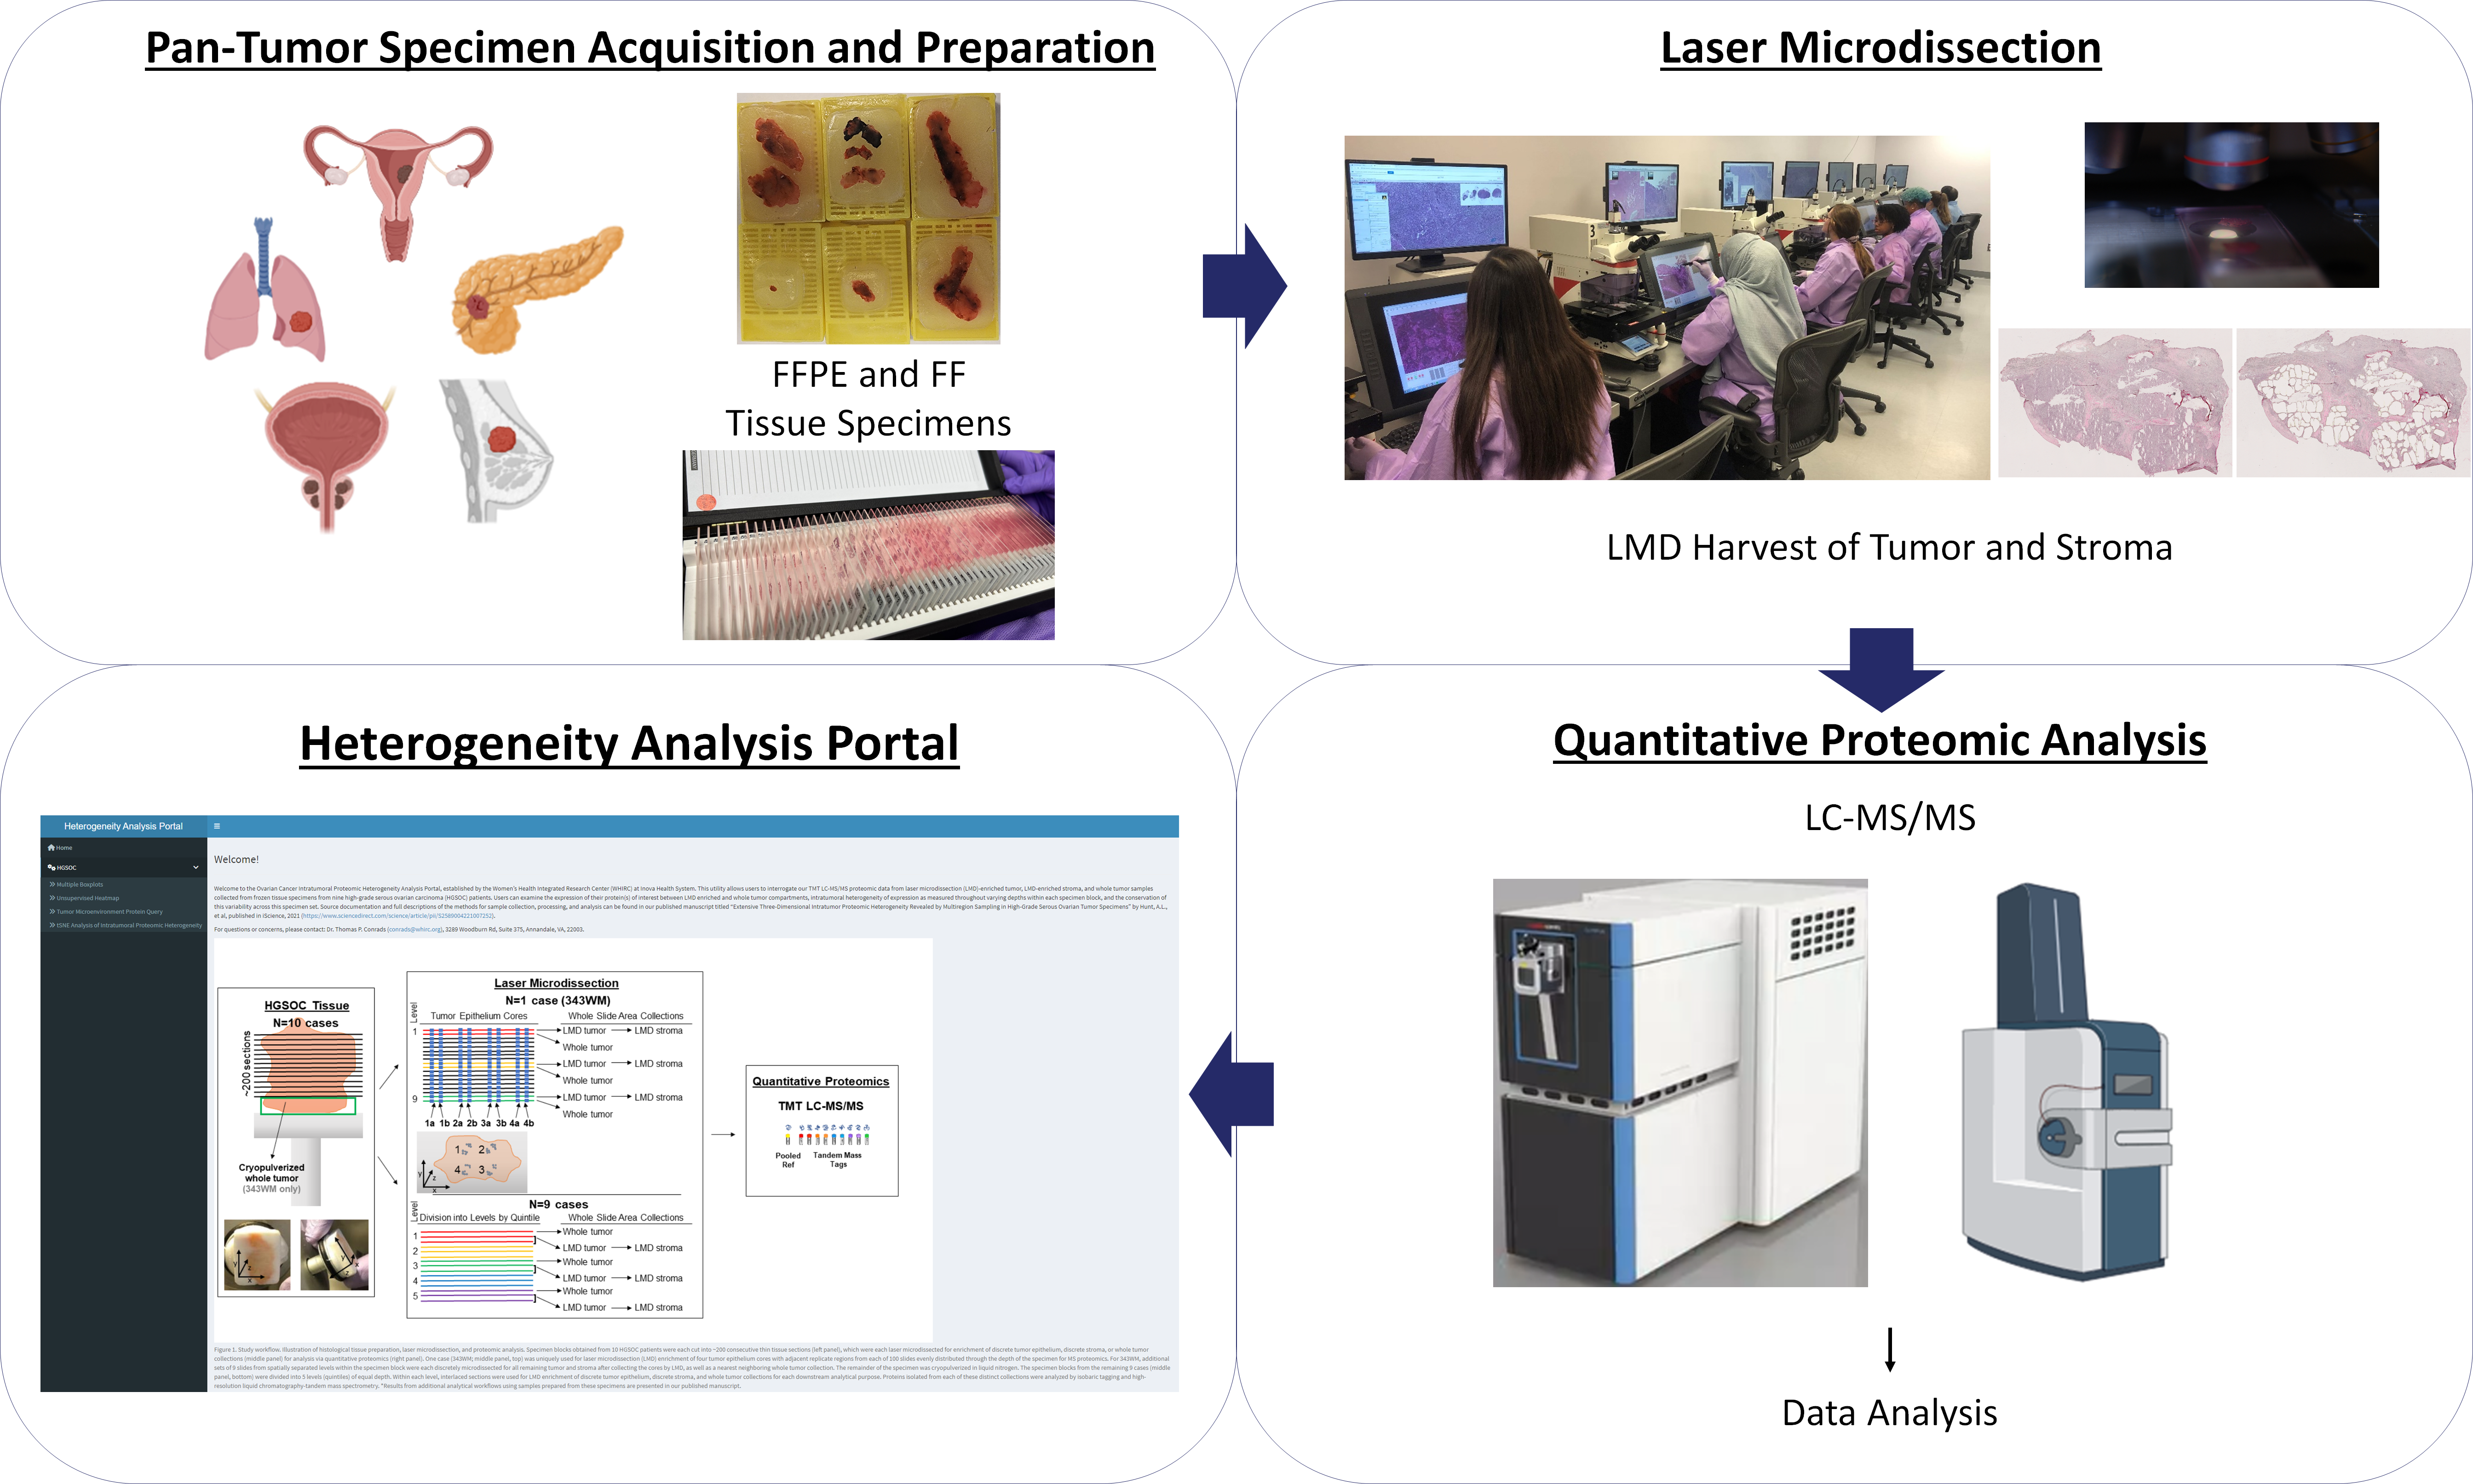 Extensive heterogeneity exists within the tumor tissue microenvironment (TME), owing largely to an interactive cellular and acellular ecosystem comprised of tumor epithelium, cancer-associated fibroblasts and other stromal, endothelial, adipocyte, and immune cells, as well as an intricate extracellular matrix (ECM).[1-3] Detailed identification of the processes driving initiation, progression, metastasis, and chemoresistance is predicated by an improved understanding of the molecular crosstalk between tumor and non-tumor cell populations within the TME. To this end, laser microdissection (LMD) provides a means to selectively harvest distinct cellular subpopulations from the TME[4, 5] enabling histologically and spatially resolved multi-omic analyses for comprehensive molecular characterization of the expression paradigms from each cell type in the TME. [6-11]
The Intratumoral Proteomic Heterogeneity Analysis Portal, established by the Women’s Health Integrated Research Center (WHIRC) at Inova Health System, allows users to interrogate our quantitative mass spectrometry-based proteomic analyses of LMD-enriched tumor, LMD-enriched stroma, and bulk/whole tumor samples harvested from cancer tissue specimens from various organ site malignancies.
Extensive heterogeneity exists within the tumor tissue microenvironment (TME), owing largely to an interactive cellular and acellular ecosystem comprised of tumor epithelium, cancer-associated fibroblasts and other stromal, endothelial, adipocyte, and immune cells, as well as an intricate extracellular matrix (ECM).[1-3] Detailed identification of the processes driving initiation, progression, metastasis, and chemoresistance is predicated by an improved understanding of the molecular crosstalk between tumor and non-tumor cell populations within the TME. To this end, laser microdissection (LMD) provides a means to selectively harvest distinct cellular subpopulations from the TME[4, 5] enabling histologically and spatially resolved multi-omic analyses for comprehensive molecular characterization of the expression paradigms from each cell type in the TME. [6-11]
The Intratumoral Proteomic Heterogeneity Analysis Portal, established by the Women’s Health Integrated Research Center (WHIRC) at Inova Health System, allows users to interrogate our quantitative mass spectrometry-based proteomic analyses of LMD-enriched tumor, LMD-enriched stroma, and bulk/whole tumor samples harvested from cancer tissue specimens from various organ site malignancies.
1. Bagaev A, Kotlov N, Nomie K, Svekolkin V, Gafurov A, Isaeva O, Osokin N, Kozlov I, Frenkel F, Gancharova O, Almog N, Tsiper M, Ataullakhanov R, Fowler N. Conserved pan-cancer microenvironment subtypes predict response to immunotherapy. Cancer Cell. 2021;39(6):845-65.e7. doi: 10.1016/j.ccell.2021.04.014.
2. Luo H, Xia X, Huang L-B, An H, Cao M, Kim GD, Chen H-N, Zhang W-H, Shu Y, Kong X, Ren Z, Li P-H, Liu Y, Tang H, Sun R, Li C, Bai B, Jia W, Liu Y, Zhang W, Yang L, Peng Y, Dai L, Hu H, Jiang Y, Hu Y, Zhu J, Jiang H, Li Z, Caulin C, Park J, Xu H. Pan-cancer single-cell analysis reveals the heterogeneity and plasticity of cancer-associated fibroblasts in the tumor microenvironment. Nature Communications. 2022;13(1):6619. doi: 10.1038/s41467-022-34395-2.
3. Rohatgi N, Ghoshdastider U, Baruah P, Kulshrestha T, Skanderup AJ. A pan-cancer metabolic atlas of the tumor microenvironment. Cell Reports. 2022;39(6). doi: 10.1016/j.celrep.2022.110800.
4. Emmert-Buck MR, Bonner RF, Smith PD, Chuaqui RF, Zhuang Z, Goldstein SR, Weiss RA, Liotta LA. Laser capture microdissection. Science. 1996;274(5289):998-1001. Epub 1996/11/08. PubMed PMID: 8875945.
5. Bonner RF, Emmert-Buck M, Cole K, Pohida T, Chuaqui R, Goldstein S, Liotta LA. Laser Capture Microdissection: Molecular Analysis of Tissue. Science. 1997;278(5342):1481-3. doi: 10.1126/science.278.5342.1481.
6. Burdett NL, Willis MO, Alsop K, Hunt AL, Pandey A, Hamilton PT, Abulez T, Liu X, Hoang T, Craig S, Fereday S, Hendley J, Garsed DW, Milne K, Kalaria S, Marshall A, Hood BL, Wilson KN, Conrads KA, Pishas KI, Ananda S, Scott CL, Antill Y, McNally O, Mileshkin L, Hamilton A, Au-Yeung G, Devereux L, Thorne H, Bild A, Bateman NW, Maxwell GL, Chang JT, Conrads TP, Nelson BH, Bowtell DDL, Christie EL. Multiomic analysis of homologous recombination-deficient end-stage high-grade serous ovarian cancer. Nature Genetics. 2023. doi: 10.1038/s41588-023-01320-2.
7. Soltis AR, Bateman NW, Liu J, Nguyen T, Franks TJ, Zhang X, Dalgard CL, Viollet C, Somiari S, Yan C, Zeman K, Skinner WJ, Lee JSH, Pollard HB, Turner C, Petricoin EF, Meerzaman D, Conrads TP, Hu H, Shriver CD, Moskaluk CA, Browning RF, Jr., Wilkerson MD. Proteogenomic analysis of lung adenocarcinoma reveals tumor heterogeneity, survival determinants, and therapeutically relevant pathways. Cell Rep Med. 2022;3(11):100819. Epub 2022/11/18. doi: 10.1016/j.xcrm.2022.100819. PubMed PMID: 36384096; PMCID: PMC9729884.
8. Lee S, Zhao L, Rojas C, Bateman NW, Yao H, Lara OD, Celestino J, Morgan MB, Nguyen TV, Conrads KA, Rangel KM, Dood RL, Hajek RA, Fawcett GL, Chu RA, Wilson K, Loffredo JL, Viollet C, Jazaeri AA, Dalgard CL, Mao X, Song X, Zhou M, Hood BL, Banskota N, Wilkerson MD, Te J, Soltis AR, Roman K, Dunn A, Cordover D, Eterovic AK, Liu J, Burks JK, Baggerly KA, Fleming ND, Lu KH, Westin SN, Coleman RL, Mills GB, Casablanca Y, Zhang J, Conrads TP, Maxwell GL, Futreal PA, Sood AK. Molecular Analysis of Clinically Defined Subsets of High-Grade Serous Ovarian Cancer. Cell Rep. 2020;31(2):107502. Epub 2020/04/16. doi: 10.1016/j.celrep.2020.03.066. PubMed PMID: 32294438; PMCID: PMC7234854.
9. Hunt AL, Bateman NW, Barakat W, Makohon-Moore S, Hood BL, Conrads KA, Zhou M, Calvert V, Pierobon M, Loffredo J, Litzi TJ, Oliver J, Mitchell D, Gist G, Rojas C, Blanton B, Robinson EL, Odunsi K, Sood AK, Casablanca Y, Darcy KM, Shriver CD, Petricoin EF, Rao UNM, Maxwell GL, Conrads TP. Extensive three-dimensional intratumor proteomic heterogeneity revealed by multiregion sampling in high-grade serous ovarian tumor specimens. iScience. 2021;24(7):102757. doi: https://doi.org/10.1016/j.isci.2021.102757.
10. Busso-Lopes AF, Neves LX, Câmara GA, Granato DC, Pretti MAM, Heberle H, Patroni FMS, Sá J, Yokoo S, Rivera C, Domingues RR, Normando AGC, De Rossi T, Mello BP, Galdino NAL, Pauletti BA, Lacerda PA, Rodrigues AAN, Casarim ALM, de Lima-Souza RA, Damas II, Mariano FV, Gollob KJ, Medina TS, Cervigne NK, Prado-Ribeiro AC, Brandão TB, Villa LL, Uno M, Boroni M, Kowalski LP, González-Arriagada WA, Paes Leme AF. Connecting multiple microenvironment proteomes uncovers the biology in head and neck cancer. Nature Communications. 2022;13(1):6725. doi: 10.1038/s41467-022-34407-1.
11. Mitchell D, Hunt AL, Conrads KA, Hood BL, Makohon-Moore SC, Rojas C, Maxwell GL, Bateman NW, Conrads TP. Industrialized, Artificial Intelligence-guided Laser Microdissection for Microscaled Proteomic Analysis of the Tumor Microenvironment. J Vis Exp. 2022(184). Epub 20220603. doi: 10.3791/64171. PubMed PMID: 35723500.
Upload list of IDs from entire matrix (Can be downloaded from the boxplot tab) Column name should be ID.
Download Sample Dataset
Download Boxplots
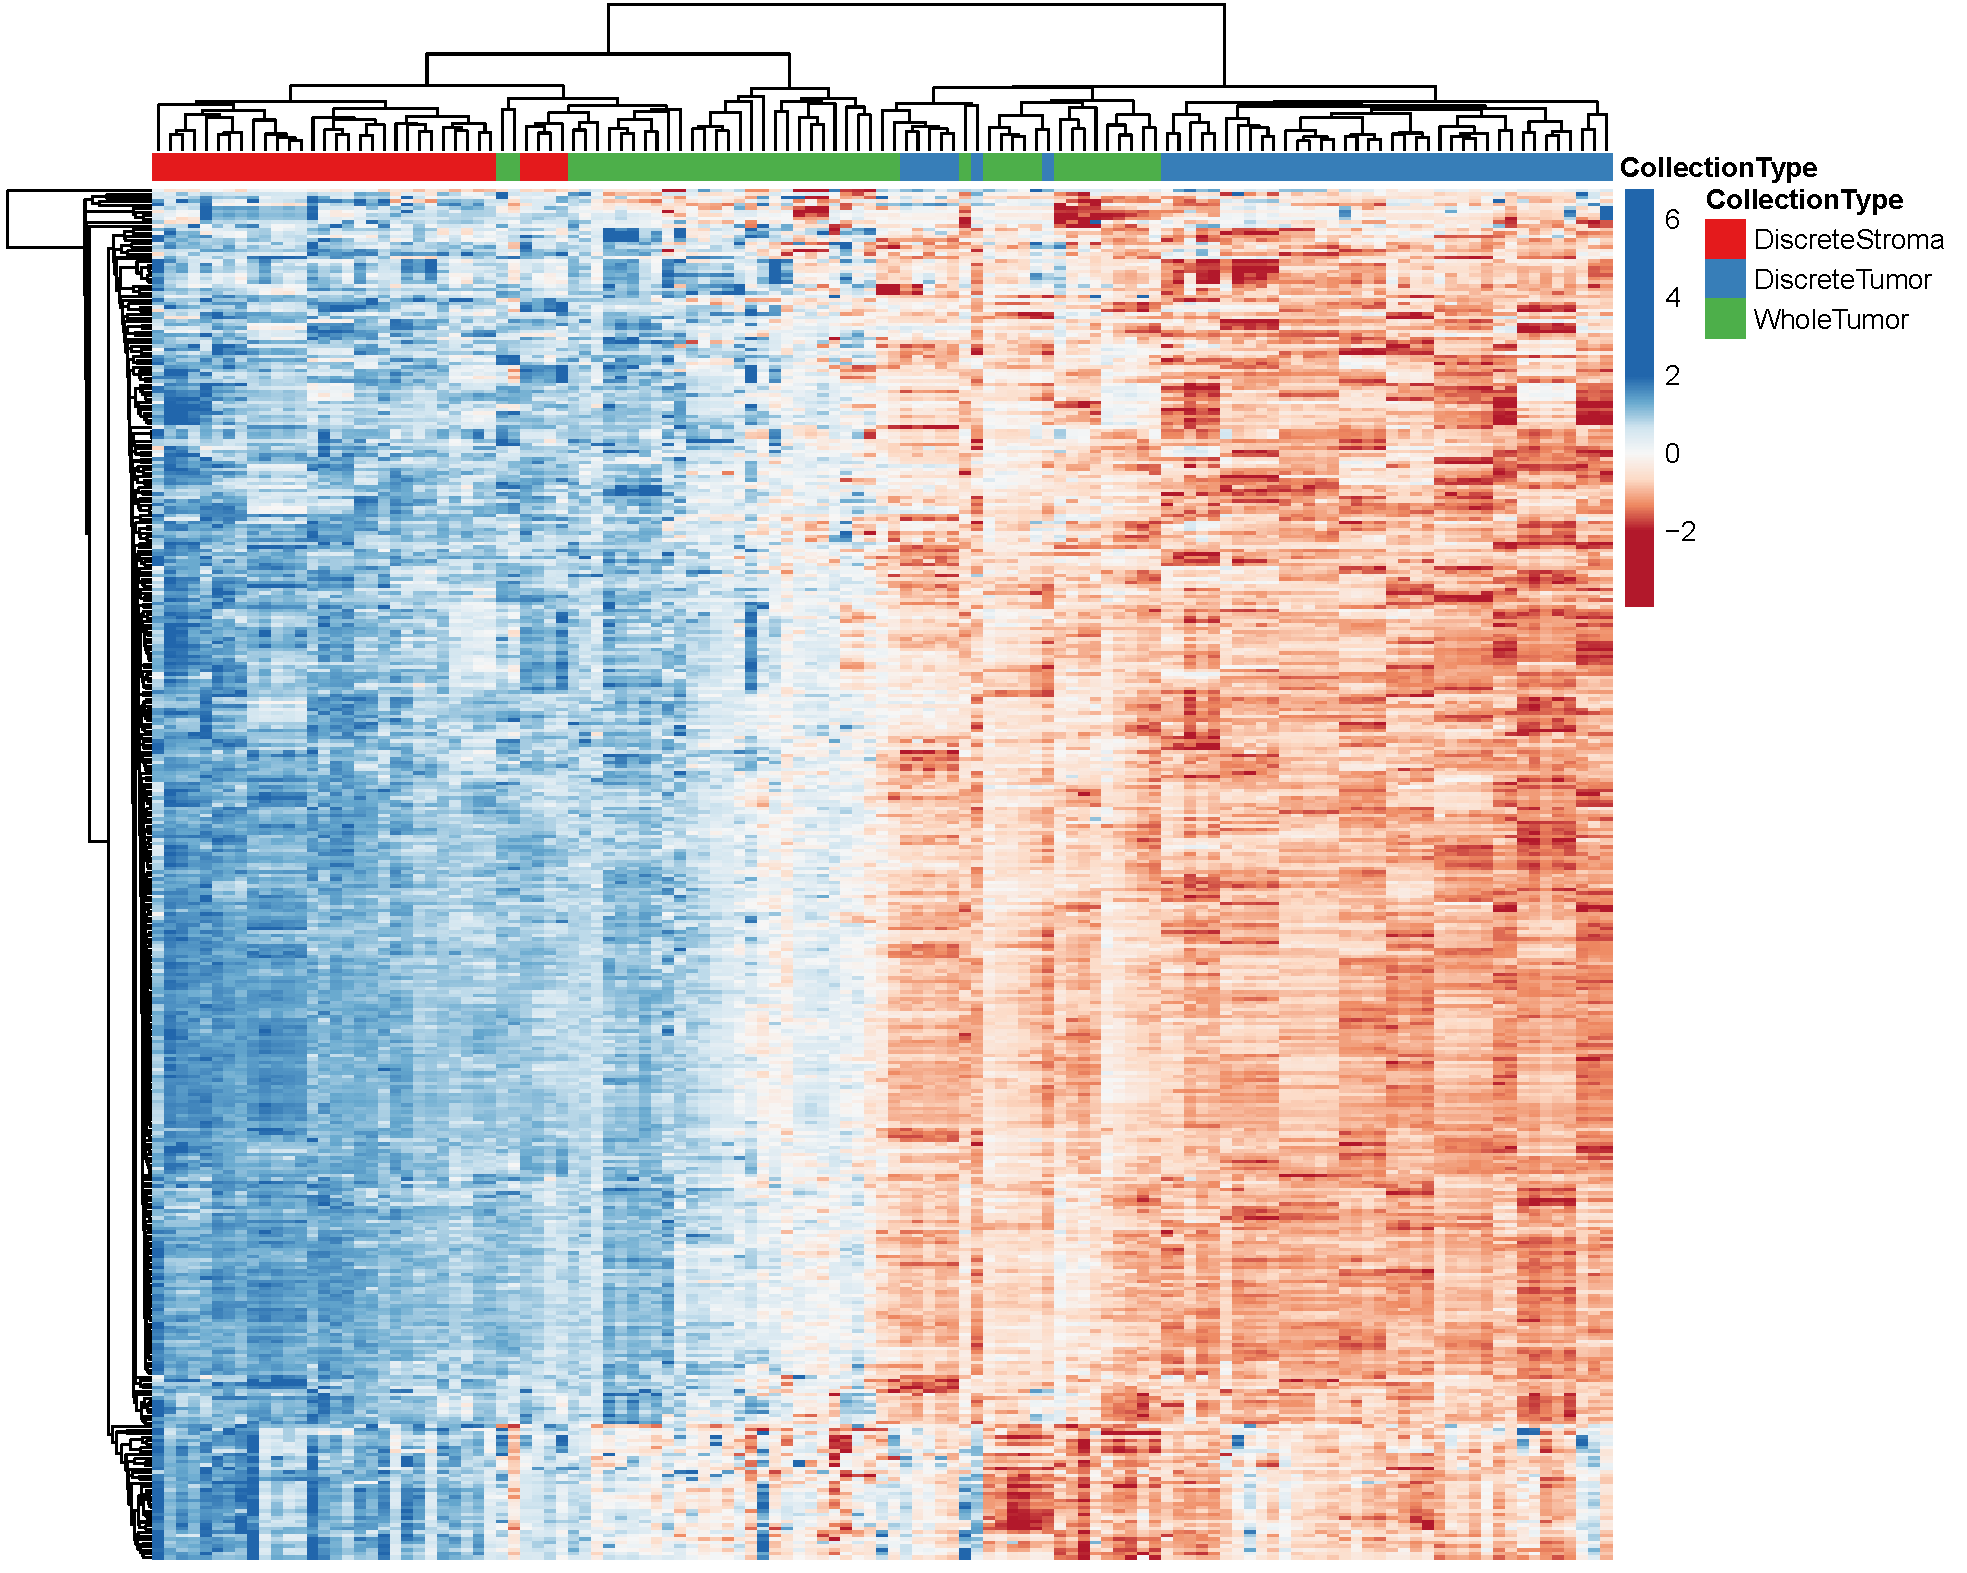 Unsupervised hierarchical cluster analysis of differentially abundant proteins. 6,199 differentially abundant proteins with median absolute deviation (MAD) >1.
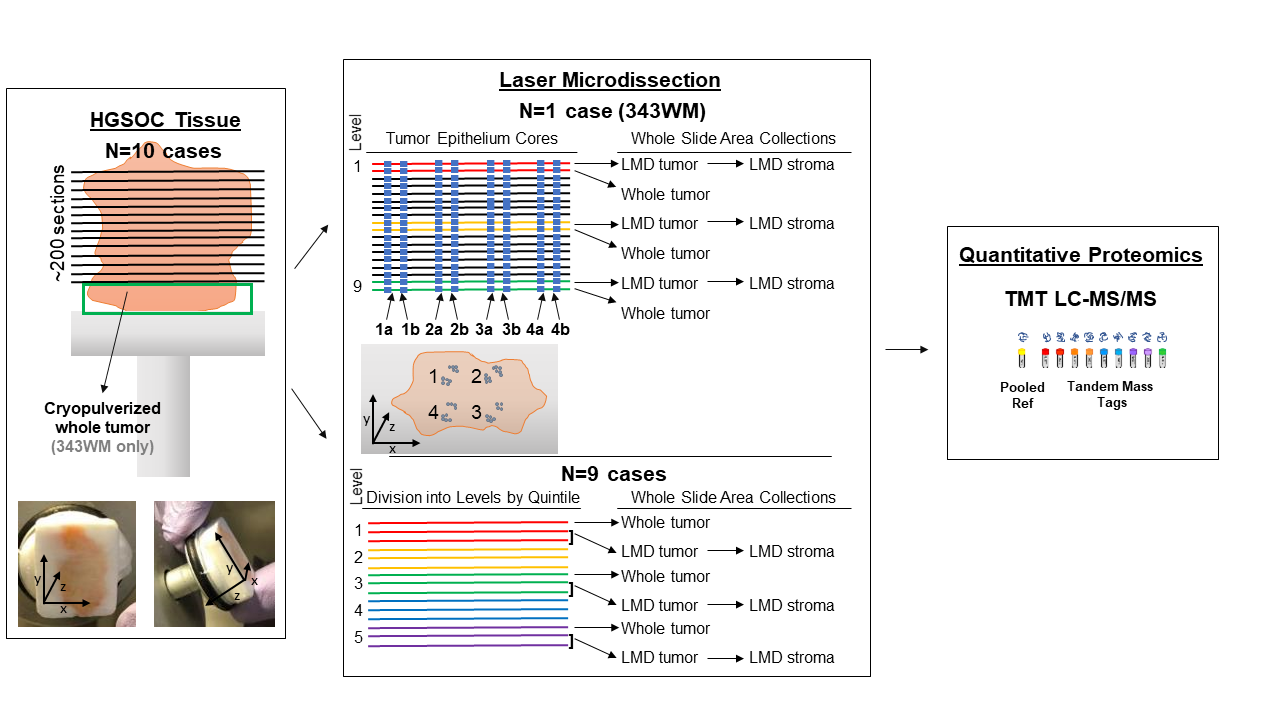
Protein abundances are represented across n=123 samples derived from n=9 patients consisting of: LMD enriched tumor epithelium (n=45 total; 5 levels/patient), LMD enriched stroma (n=33 total; 2-5 levels/patient), and whole tumor (n=45 total; 5 levels/patient) samples.
Unsupervised hierarchical cluster analysis of differentially abundant proteins. 6,199 differentially abundant proteins with median absolute deviation (MAD) >1.
Protein abundances are represented across n=123 samples derived from n=9 patients consisting of: LMD enriched tumor epithelium (n=45 total; 5 levels/patient), LMD enriched stroma (n=33 total; 2-5 levels/patient), and whole tumor (n=45 total; 5 levels/patient) samples.
This tool generates boxplots depicting Log2 transformed fold-change abundances in LMD enriched and whole tumor compartments from tumor specimens obtained from each of 9 HGSOC patients. The full matrix of abundances 6,199 proteins measured in the final imputed dataset across all samples (n=123) can be downloaded as a .csv file using the *Download Full Matrix* option.
Please select from the dropdown list or type in the Gene Name or Uniprot Accession ID for a protein of interest. The boxplot below will automatically update to reflect your selection and can be downloaded as a .png image file using the “Download Boxplot” option. The Wilcox p-value measuring the significance of differential expression between LMD enriched tumor and LMD enriched stroma is shown above the boxplot in the web tool. Relative abundance values for the selected protein can be downloaded using the “Download Selected Gene” option. Proteins that are not found in this list were not measured in our final merged imputed dataset.
If you use this tool for published work, please cite:
Hunt, A.L., et al., Extensive Three-Dimensional Intratumor Proteomic Heterogeneity Revealed by Multiregion Sampling in High-Grade Serous Ovarian Tumor Specimens. iScience, 2021
Download Full Matrix
Download Selected Gene
Download Boxplot
Please select from the dropdown list or type in the Gene Name or Uniprot Accession ID for a protein of interest. The boxplot below will automatically update to reflect your selection and can be downloaded as a .png image file using the “Download Boxplot” option. The Wilcox p-value measuring the significance of differential expression between LMD enriched tumor and LMD enriched stroma is shown above the boxplot in the web tool. Relative abundance values for the selected protein can be downloaded using the “Download Selected Gene” option. Proteins that are not found in this list were not measured in our final merged imputed dataset.
If you use this tool for published work, please cite:
Hunt, A.L., et al., Extensive Three-Dimensional Intratumor Proteomic Heterogeneity Revealed by Multiregion Sampling in High-Grade Serous Ovarian Tumor Specimens. iScience, 2021
Wilcox p-value of Enriched Tumor vs Enriched Stroma:
This tool shows three-dimensional tSNE plots depicting the relationship of protein samples from our n=9 and n=1 HGSOC patient specimen sets. Hover over the plot to zoom, move or save the plots.
Loading...
Loading...
Loading...
Loading...
Upload list of IDs from entire matrix (Can be downloaded from the boxplot tab) Column name should be ID.
Download Sample Dataset
Download Boxplots
 Unsupervised hierarchical cluster analysis of differentially abundant proteins. 351 variably abundant proteins (MAD>1). Protein abundances are represented across 118 samples derived from n=9 patients consisting of ET (n=44 total; 4-5 levels/patient), ES (n=29 total; 2-5 levels/patient), and BT (n=45 total; 5 levels/patient). The color gradient inset below the heatmap depicts median tumor purity estimates per level, determined by manual pathology review for each of the BT collections.

This tool generates boxplots depicting Log2 transformed fold-change abundances in LMD enriched and whole tumor compartments from tumor specimens obtained from each of 9 USC patients. The full matrix of abundances 6,503 proteins measured in the final imputed dataset across all samples (n=118) can be downloaded as a .csv file using the “Download Full Matrix” option.
Please select from the dropdown list or type in the Gene Name or Uniprot Accession ID for a protein of interest. The boxplot below will automatically update to reflect your selection and can be downloaded as a .png image file using the “Download Boxplot” option. The Wilcox p-value measuring the significance of differential expression between LMD enriched tumor and LMD enriched stroma is shown above the boxplot in the web tool. Relative abundance values for the selected protein can be downloaded using the “Download Selected Gene” option. Proteins that are not found in this list were not measured in our final merged imputed dataset.
If you use this tool for published work, please cite:
Hunt, A.L., et al., Mapping three-dimensional intratumor proteomic heterogeneity in uterine serous carcinoma by multiregion microsampling. Clinical Proteomics, 2024.
Download Full Matrix
Download Selected Gene
Download Boxplot
Please select from the dropdown list or type in the Gene Name or Uniprot Accession ID for a protein of interest. The boxplot below will automatically update to reflect your selection and can be downloaded as a .png image file using the “Download Boxplot” option. The Wilcox p-value measuring the significance of differential expression between LMD enriched tumor and LMD enriched stroma is shown above the boxplot in the web tool. Relative abundance values for the selected protein can be downloaded using the “Download Selected Gene” option. Proteins that are not found in this list were not measured in our final merged imputed dataset.
If you use this tool for published work, please cite:
Hunt, A.L., et al., Mapping three-dimensional intratumor proteomic heterogeneity in uterine serous carcinoma by multiregion microsampling. Clinical Proteomics, 2024.
Wilcox p-value of Enriched Tumor vs Enriched Stroma:
This tool shows three-dimensional tSNE plots depicting the relationship of protein samples from our n=9 USC patient specimens. Hover over the plot to zoom, move, or save the plots.
Loading...
Loading...