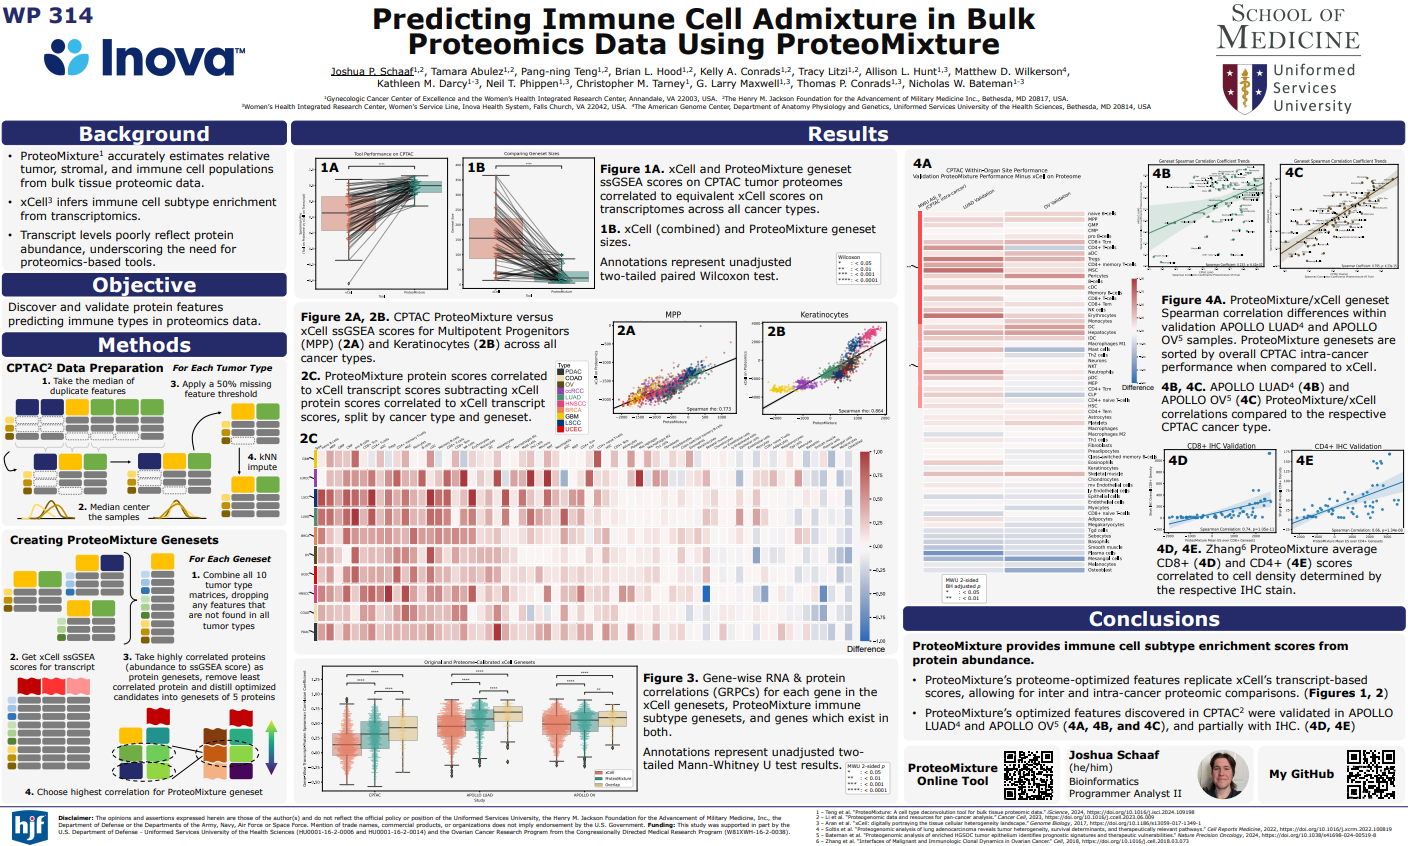
ProteoMixture
A software tool supporting prediction of tumor, stroma and immune cell admixture in bulk ovarian cancer tissue collections using protein-level abundance data.
Welcome to ProteoMixture, established by the Women’s Health Integrated Research Center (WHIRC) at Inova Health System. This tool allows users to interrogate protein abundance data and download tumor, immune and stromal scores. Description of the high grade serous ovarian cancer (HGSOC) tissue samples and methods for prioritizing cell type protein signatures can be found in our manuscript titled “ProteoMixture: A Cell Type Deconvolution Tool for Bulk Tissue Proteomics Data” by Pang-ning Teng, Joshua P Schaaf, Tamara Abulez, Brian L Hood, Katlin N Wilson, Tracy J Litzi, Kelly A Conrads, Allison L Hunt, Victoria Olowu, Julie Oliver, Fred S Park, Marshe Edwards, AiChun Chiang, Praveen-Kumar Raj-Kumar, Christopher M Tarney, Kathleen M Darcy, Neil T Phippen, George L Maxwell, Thomas P Conrads, and Nicholas W Bateman, published in iScience on February 12, 2024. Please contact Dr. Nicholas W. Bateman (batemann@whirc.org), Women’s Health Integrated Research Center at Inova Health System, 3289 Woodburn Road, Suite 370, Annandale, VA 22003; Tel: 703-207-3362; or Dr. Thomas P. Conrads (conrads@whirc.org), 3289 Woodburn Rd., Suite 375, Annandale, VA 22003 for any questions.

Usage
To apply ssGSEA with these feature sets on your data, click the Upload & Analyze tab in the left section of the dashboard. An example input matrix is provided, as well as options for analysis of results and missing data. Additionally, the gene sets are available for download.
Code and Data
A repository on github, https://github.com/GYNCOE/Teng.et.al.2024, holds code and data used in analyses and figure generation for the Teng. et al 2024 admixture manuscript.
ProteoMixture
A software tool supporting prediction of tumor, stroma and immune cell admixture in bulk ovarian cancer tissue collections using protein-level abundance data.
Datasets should be formatted with log2 abundance values, using rows as UniProt accession numbers (or gene names), and columns as samples. An example dataset is provided below.Example Dataset
This example dataset represents samples from enriched tumor, enriched stroma, or whole tumor collections (https://doi.org/10.1016/j.isci.2021.102757), specifically Table S7 (https://ars.els-cdn.com/content/image/1-s2.0-S2589004221007252-mmc8.xlsx). For this tool, the data was converted from an excel sheet to a .csv file and a few samples were removed to reduce file size. To re-create results from this paper (https://www.cell.com/iscience/fulltext/S2589-0042(24)00419-X), do NOT normalize or reduce the dataset. Download Example DatasetDownload Gene Sets
The gene sets identified from our published manuscript (https://www.cell.com/iscience/fulltext/S2589-0042(24)00419-X) are provided here. Gene sets are provided have their rank from RFE and the gene name associated with their accession number.Upload Abundances
Analysis begins right after a successful upload of a matrix, so make sure to select the options *before* uploading your data!
Analysis Options:
Results
ProteoMixture Immune (BETA)
A software tool supporting prediction of specific immune cell subtypes in bulk cancer tissue collections using protein-level abundance data.
Datasets should be formatted with log2 abundance values, using rows as UniProt accession numbers (or gene names), and columns as samples. Examples are provided below. Only CD4+ and CD8+ genesets are provided currently, as they were validated with IHC.